Abstract
Background: The International Statistical Classification of Diseases and Related Health Problems (ICD) codes play a critical role as fundamental data for hospital management and can significantly impact diagnosis-related groups (DRGs). This study investigated the quality issues associated with ICD data and their impact on improper DRG payments. Methods: Our study analyzed data from a Chinese hospital from 2016-2017 to evaluate the impact of ICD data quality on Chinese Diagnosis-related Group (CN-DRG) evaluation variables and payments. We assessed different stages of the ICD generation process and established a standardized process for evaluating ICD data quality and relevant indicators. The validation of the data quality assessment (DQA) was confirmed through sampling data. Results: This study of 85,522 inpatient charts found that gynecology had the highest and obstetrics had the lowest diagnosis agreement rates. Pediatrics had the highest agreement rates for MDC and DRG, while neonatal pediatrics had the lowest. The Case Mix Index (CMI) of Coder-coded data showed to be more reasonable than physician-coded data, with increased DRG payments in obstetrics and gynecology. The DQA model revealed coding errors ranging from 40.3 percent to 65.1 percent for physician and 12.2 percent to 23.6 percent for coder. Payment discrepancies were observed, with physicians resulting in underpayment and coders displaying overpayment in some cases. Conclusion: ICD data is crucial for effective healthcare management, and implementing standardized and automated processes to assess ICD data quality can improve data accuracy. This enhances the ability to make reasonable DRG payments and accurately reflects the quality of healthcare management.
Keywords: ICD code; diagnosis-related groups (DRG); data quality assessment (DQA); diagnosis-related groups (DRGs); improper payment
Introduction
In 1983, the US government instituted case mix funding for Medicare nationwide to manage rising healthcare costs. The reimbursement of hospitals through case mix systems such as diagnosis-related groups (DRGs) aimed to reduce the average length of hospital stay and thus increase the efficiency of and equitably allocate health resources and services.
DRG assignment for a patient depends on several factors, including diagnoses, procedures, and the presence of complications and comorbidities (CCs)1, which are coded using the International Statistical Classification of Diseases and Related Problems (ICD) system. The quality of ICD data affects the scientific construction of DRG models, and more accurate data should be used to the US Centers for Medicare and Medicaid Services (CMS) to recalculate the DRG payment weights and remove anomalies in the DRG payment weights 2. In 2019, the US Medicare Fee-for-Service showed upcoding errors led to approximately $254 million (0.2 percent) improper payments in the part A hospital inpatient prospective payment system 3. Accurate ICD codes are critical for DRG and play a vital role in medical decision support, resource allocation, reimbursement, guidelines, and more 4.
The assignment of ICD codes is a complex and multifaceted process that involves patients, physicians, and coders. This process can present opportunities for coding errors, including omission, unbundling, upcoding, and sequencing errors 5. In recent years, there has been a growing interest in investigating the quality of ICD codes, with numerous studies examining the accuracy of ICD codes for identifying various health conditions 6-7. The results of these studies can inform efforts to improve the precision and dependability of ICD codes, which can ultimately enhance the quality of clinical care and public health surveillance. However, the consistency and comparability of ICD data quality assessment outcomes in these studies are questionable.
To restrain the excessive growth of medical expenses, China has implemented the diagnosis-intervention packet (DIP) and DRG payment systems based on local conditions, continuously refining them. Recent exploratory research has probed the pilot results of group-based payments, highlighting the importance of ICD coding quality in these payment structures 8-9. Nonetheless, scarce data exists regarding the quality of ICD codes and their impact on DRGs. A coding quality evaluation undertaken in China 10 unveiled a median coding error rate (encompassing both primary and secondary diagnoses) of 12.9 percent, while the primary diagnosis median coding error rate constituted an alarming 24.7 percent.
Therefore, this study aims to evaluate the impact of ICD codes from a Chinese hospital on DRG variables and payments. Additionally, a novel data quality assessment (DQA) process and standardized indicators were established to evaluate the quality of ICD codes to assess the extent to which ICD coding errors impact DRG grouping and payment. The goals of this study are to identify the primary challenges and opportunities for future improvements in ICD coding quality and to promote the implementation of rational allocation plans for health resources in China.
Methods
Study Design
Within healthcare establishments across Guangdong Province, physicians document patients' diagnoses and procedures, along with their corresponding ICD codes, upon discharge. The Discharge Fee Office subsequently settles medical insurance expenses based on the physician-coded data. After discharge, patients' medical records are collected in the Medical Records Department, where coders meticulously review and refine the ICD codes initially recorded by the physicians. Once the data has been verified, the Information Management Center uploads the coder-coded data and medical records to the Provincial Bureau of Statistics and Medicare Center on a monthly basis. The Center for Medicare Services periodically audits the data, permitting healthcare institutions to appeal for a recalculation of medical insurance expenses. Medical insurance payment expenses are recalculated based on the ICD data, relative weight, and adjustment factors. The inpatient coding process is illustrated in Figure 1.
Figure 1: Impatient coding process
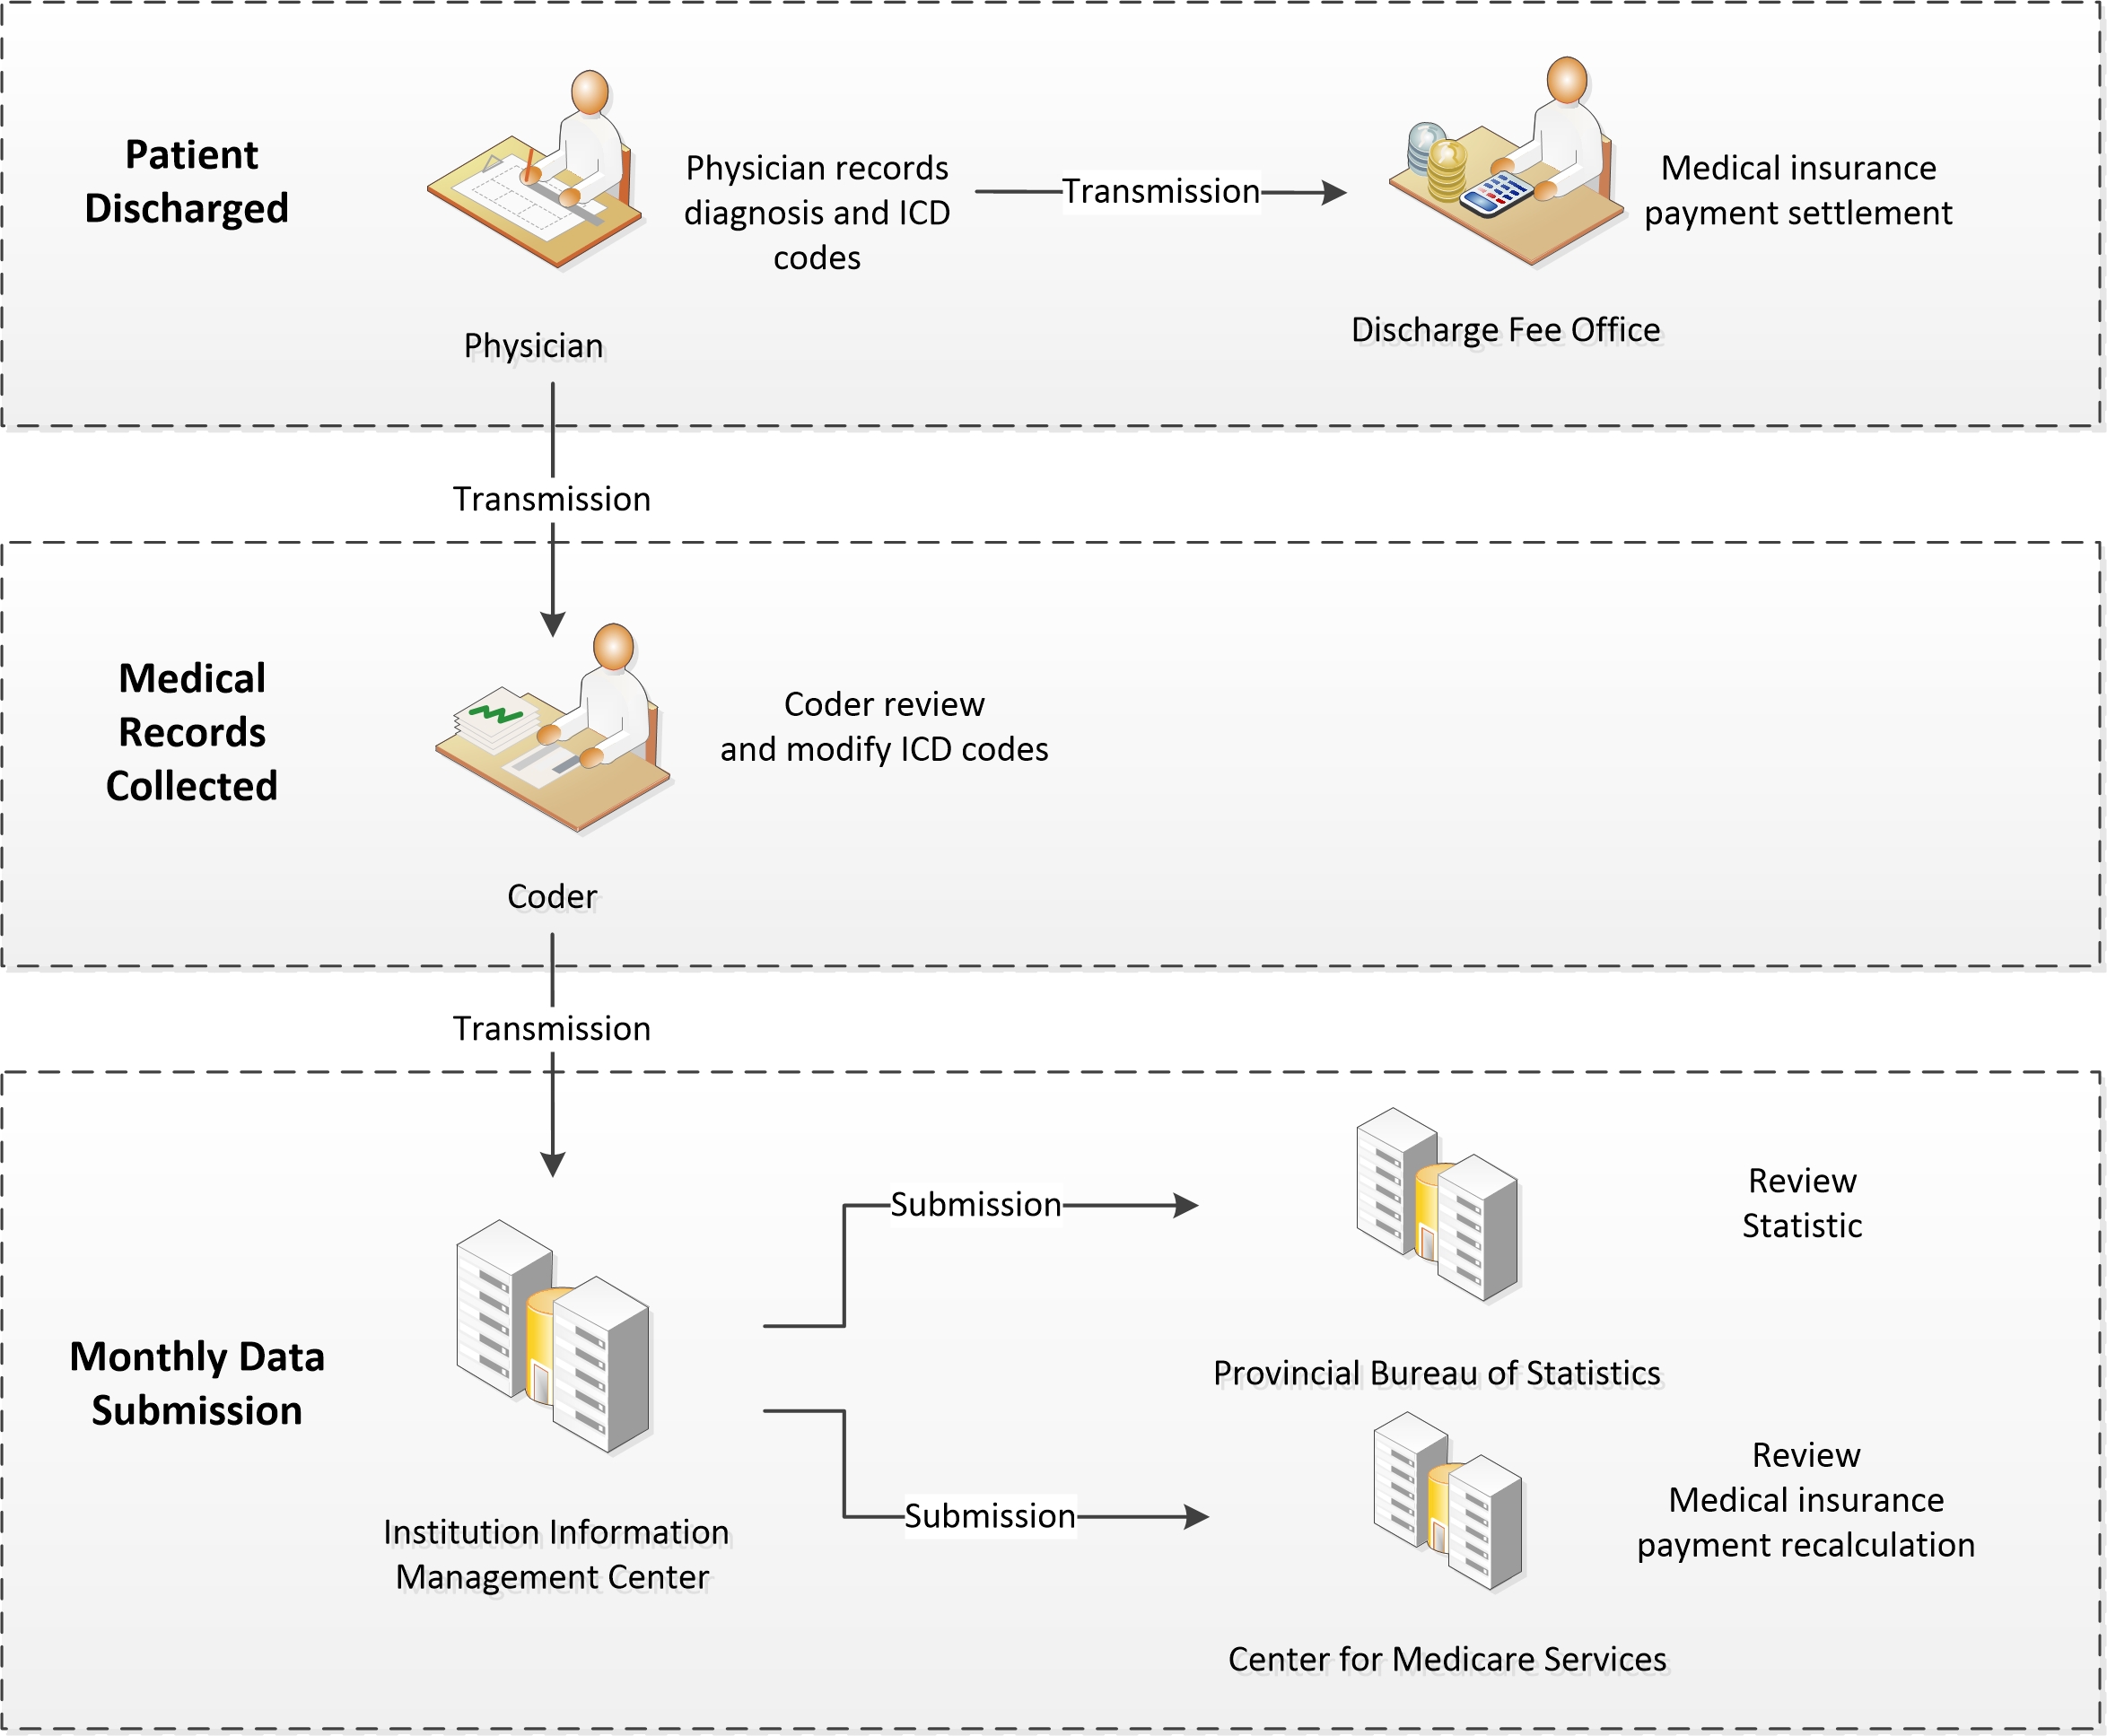
Figure 1. The ICD coding process in healthcare institutions across Guangdong Province: physicians record patient diagnoses and procedures upon discharge, coders then review and refine the ICD codes, which are uploaded to the Medicare Center for medical insurance expense calculation and audit.
We used the Chinese Diagnosis-Related Group (CN-DRG@) system to group the data coded by both physician and coder, then conducted a comparison of the ICD codes and DRG variables between physician and coder for 85,522 charts between 2016 and 2017.
We estimated the required sample size for our study using the Z-test sample size estimation method, considering an expected proportion of 30 percent, a confidence level of 95 percent, and a margin of error of 5 percent, taking into account specific grouping rate and missing data issues. Based on those criteria, we employed a stratified sampling approach, randomly selecting a sample of 350 charts from a total of 85,522 charts.
We designated two coding quality control specialists to conduct blind peer-review. These specialists were selected based on strict criteria to ensure their objectivity and professionalism. First, each candidate was required to possess qualifications from nationally recognized medical coding and quality control examinations. This requirement guaranteed that all participants had the necessary theoretical knowledge and practical skills for this study. Second, candidates needed to have at least 10 years of practical experience in medical coding and quality control, ensuring their ability to adeptly manage various complex scenarios they might encounter. Finally, the experts were meticulously chosen from the hospital's medical records quality management department, specifically for their significant contributions to improving coding accuracy and data quality. Additionally, they had no affiliations or vested interests with the coder or this study. By adhering to these rigorous selection procedures, we ensured the accuracy and integrity of the ICD data quality assessment in our study.
We anonymized the medical records by excluding the coder's name, institution, and any other identifying information to ensure unbiased appraisal of coding quality. We solicited feedback from the specialists and evaluated it based on the predetermined criteria. In case of contradictory peer review outcomes, two specialists reviewed the results again, and the final outcome agreed upon was documented. The final outcome was what we refer to as specialist-coded data.
We conducted DQA on the physician-coded and coder-coded data by comparing them with the specialist-coded data. We then reorganized the specialist-coded data using the CN-DRG@ system to identify the new CN-DRG@ data. Finally, we compared the new CN-DRG@ data with the physician-coded and coder-coded CN-DRG@ data to identify any changes in the assignment of the hospital tariff. The study design is outlined in Figure 2.
Figure 2: Study design
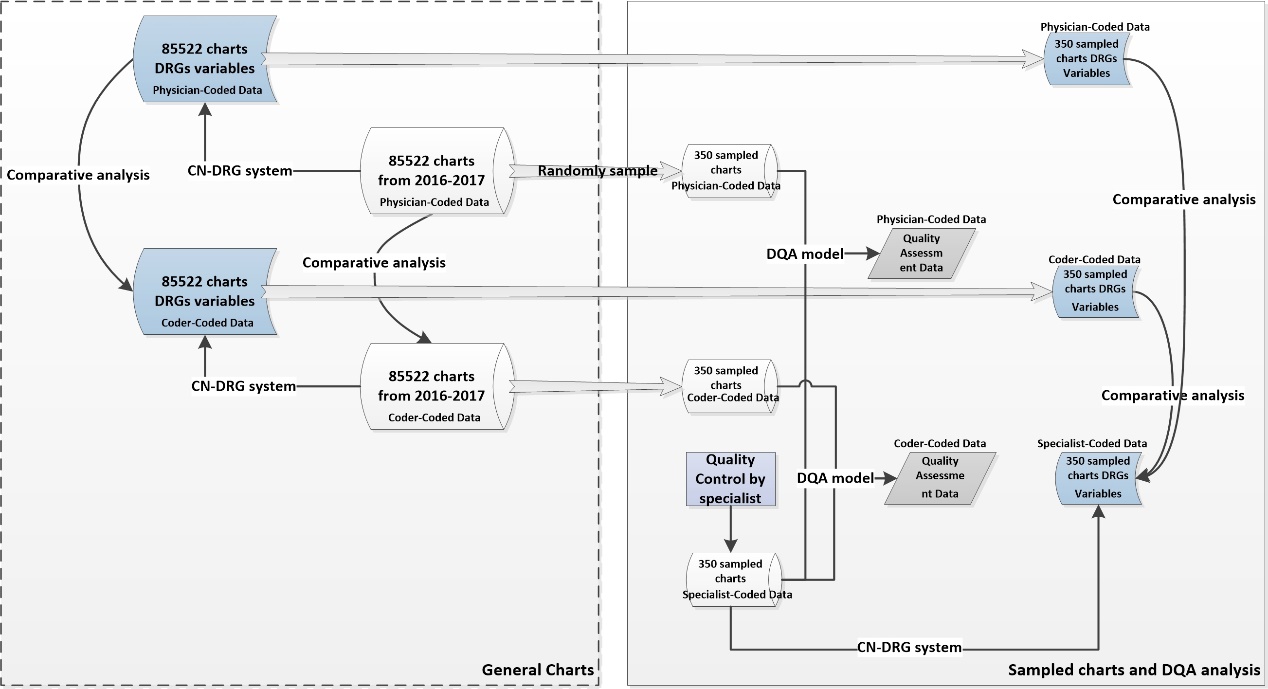
Figure 2. The study design entailed a comparative analysis of ICD codes and DRG variables through both general and sampled charts, while incorporating a DQA model to evaluate the quality of the sampled charts.
Data collection
We gathered data from the electronic medical record (EMR), Chinese diagnosis-related group (CN-DRG@), and medical record statistics systems of a Women and Children Special Hospital located in Guangdong Province. Inpatient charts from the obstetrics, gynecology, pediatrics, and neonatal pediatrics departments were chosen for analysis. The chart data included demographic information of the patients, hospitalization expenses (including separate costs for maternal and infant expenses for obstetric inpatients), length of stay, diagnosis identified by ICD-10 code (International Classification of Diseases-10th revision), procedure identified by ICD-9-CM3 code (International Classification of Diseases Operations and Procedures-9th revision, Clinical Modification), neonatal weight, gestational age, and other relevant information. The DRG variables encompassed major diagnostic categories (MDC), DRG, case mix index (CMI), and DRG payment.
We included records of patients who were discharged from the hospital between January 1, 2016 and December 31, 2017. Patient records that were not retrievable after three separate requests for the original paper records were excluded from the analysis.
Measure system
The study utilized the DQA model to evaluate the dimensions of data quality, with a strategy that adhered to the 3x3 DQA guidance framework. The ICD coding task defines data quality dimensions as follows:
a. Consistency: adherence of ICD codes to internal or external formatting, relational, or definitional standards.
b. Completeness: ICD codes are not missing and have sufficient scope and depth for the given task.
c. Timeliness: ICD codes reflect the most up-to-date values and are recorded at the appropriate absolute and relative time(s).
The DQA variables were defined based on the discharge abstract database variables (outlined in Appendix A). An ICD data quality assessment was conducted through a manual peer-review process that ensured blinding. The ICD-10 instruction manual was used to aid in the evaluation of ICD coding quality.
This study utilized the CN-DRG@ system as a measure of case mix. The Institute of Hospital Management in Beijing pioneered DRG research in 1988. In 2013, the Bureau of Medical Administration of the National Health Commission launched the CN-DRG, which includes 804 DRG groups, for hospital performance evaluation. In this study, the CN-DRG@ was used to evaluate and manage hospital performance, with a performance evaluation scope that encompassed nearly 1,000 hospitals across 29 provinces. The CCs adjustment method in the CN-DRG@ is similar to that of the Medicare Severity DRG (MS-DRG), which is subdivided based on the list of CCs and Major CCs (MCCs).
Main outcome measures
• Agreement on primary diagnosis code
Number of charts with matching primary diagnosis ICD code/total number of charts × 100.
• Agreement on DRG variables
a. MDC agreement rate. Number of charts grouped into the same MDC group Total number of charts × 100
b. DRG agreement rate. Number of charts grouped into the same DRG group/Total number of charts × 100
c. Intraclass Correlation Coefficient (ICC). The formula for calculating ICC is:
ICC = (MSB - MSW) / (MSB + (k-1)*MSW)
Where MSB is the mean square between variables, MSW is the mean square within variables, and k is the number of variables.
d. Case mix index (CMI). Calculate the weighted average of the relative weight (RW) of each DRG in the medical unit. CMI > 1 indicates that the technical difficulty or resource intensity is higher than the average level, and CMI < 1 indicates that it is lower than the average level.
RW = average cost of DRG group/average cost of all individuals
CMI = sum of RW in the medical area/total number of charts
e. Improper payment. Each DRG is assigned with a payment amount that represents a relative measure of the cost to the patient. Improper payment is any payment that should not have been made or that was made in an incorrect amount.
Incorrect amount = incorrect DRG payment – correct DRG payment
Overpayment occurs when the incorrect payment is > 0; overpayment rate = number of overpayment charts/total number of charts × 100
Underpayment occurs when the incorrect payment is < 0; underpayment rate = number of underpayment charts/total number of charts × 100.
• DQA results
The number of variables with the data quality dimension defect/total number of the variables.
Statistical analysis
The analyses were performed using Microsoft R Open 4.0.2. Leveraging the Agreement Rate and Intra-class Correlation (ICC) as evaluative criteria, we discerned variances in MDC and DRG results. Given the non-normal distribution of DRG payments within this investigation, we employed median values and interquartile ranges for their characterization. Since the CMI represents a weighted metric, we proceeded with direct comparisons. In relation to sampled data, beyond the preceding descriptive analyses, our primary focus centered upon contrasting frequency disparities in DQA results.
Results
Comparative analysis of ICD codes and DRG variables in general charts
A total of 85,522 charts from 2016 to 2017 were analyzed to determine the primary diagnosis code agreement rate, which was calculated based on two categories: exact match (6-character) and subcategory match (4-character). Gynecology had the highest primary diagnosis code agreement rate in both subcategories, with 80 percent for subcategory match and 77.4 percent for exact match. On the other hand, obstetrics had the lowest code agreement rate in both subcategories, with 48.1 percent for subcategory match and 46percent for exact match.
Table 1 provides more detailed information on the primary diagnosis code agreement rates.
Overall, the agreement rate for MDC between physician-coded data and coder-coded data is 89.3 percent. The agreement rate for DRG between physician- and coder- is 39.7 percent. The pediatrics department had the highest MDC agreement rate (95.6 percent) and DRG agreement rate (89.7 percent), and neonatal pediatrics had the lowest (83.1 percent, 23.8 percent, respectively). The ICC value for MDC between physician-coded data and coder-coded data is 0.876. Among them, the obstetrics MDC has the lowest ICC value of 0.083, while the pediatric MDC has the highest ICC value of 0.931. Furthermore, the ICC value for DRG between physician and coder is 0.328. Specifically, the neonatal pediatrics DRG has the smallest ICC value of 0.001, and the pediatric DRG has the largest ICC value of 0.94. Those results reveal the DRG variables of physician- and coder- data, with lower consistency in obstetrics and neonatal departments, and higher consistency in the pediatric department.
For all departments, the CMI of the coder- (0.60-1.40) was higher than that of the physician- (0.48-2.53) and tended to be more reasonable, except for neonatal pediatrics. Compared with the physician- DRG payment, the coder- DRG payment in obstetrics (2816.37 vs. 3573.00) and gynecology (3383.39 vs. 4516.18) increased.
Table 2 provides detailed information on the changes in DRG variables for the 85,522 charts.
DQA analysis of ICD coding in sampled charts
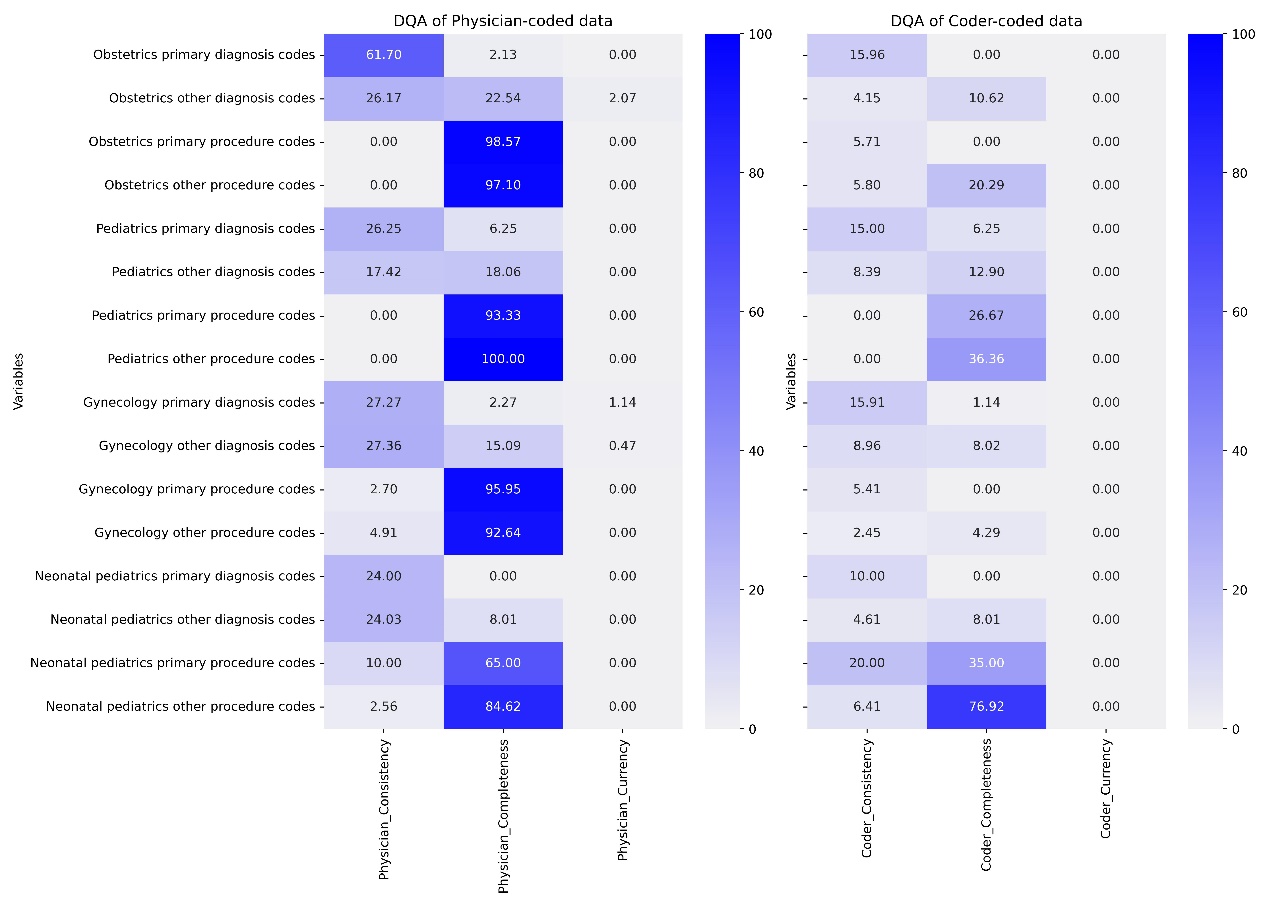
The DQA encompassed 350 sample charts for both physician- and coder- data. The analysis revealed that the physician-coded data exhibited coding error rates ranging from 40.3 percent to 65.1 percent, with gynecology displaying the poorest coding quality at 65.1 percent. Conversely, the coder- exhibited coding error rates ranging from 12.2 percent to 23.6 percent, with neonatal pediatrics exhibiting the worst coding quality at 23.6 percent. Notably, the coding error rate for procedures was higher than that of diagnoses.
Overall, the coder-coded data demonstrated higher data quality than physician-coded across all departments, with the exception of some primary procedure codes in obstetrics and gynecology.
Please refer to Table 3 for a summary of the DQA results and Figure 3 presented the detailed DQA results for the ICD variables.
Figure 3: The ICD code DQA detailed results for sampled charts
Comparative analysis of ICD codes and DRG variables in sampled charts
The DRG agreement rates between coder-coded data and specialist-coded data (ranging from 33.3 percent to 83.5 percent) were generally higher than those between physician- and specialist- (ranging from 8 percent to 73.4 percent). Analyzing the ICC value for DRG, the consistency of DRG groupings among physician-coded, coder-coded, and specialist-coded data is relatively poor, with neonatal pediatrics being the most prominent.
The CMI values for specialist- (ranging from 0.52 to 1.83) were higher than those for physician- (ranging from 0.46 to 2.88), but lower than those for coder-coded data (ranging from 0.58 to 1.23), and the specialist-coded data exhibited more reasonable CMI scores.
Most physician-coded data resulted in underpayment compared to specialist-, with an obstetric underpayment rate of 52.3 percents. In the coder-coded data, the obstetrics overpayment rate was 26.1 percent, while the neonatal pediatrics underpayment rate reached 64.6 percent.
Table 4 presents the variations in DRG variables, including CMI, DRG agreement, and DRG payment, for physician-coded, coder-coded, and specialist-coded data. Figures 4-6 visually juxtapose the assessment outcomes of CMI, DRG agreement, and DRG payment between sampled and general data. These assessment metrics display similar distribution patterns across all specialties, underscoring the high representativeness of the sampled data in this study.
Figure 4: Comparison of DRG agreement rates between general and sampled charts across specialties, revealing similar distribution patterns between the two datasets
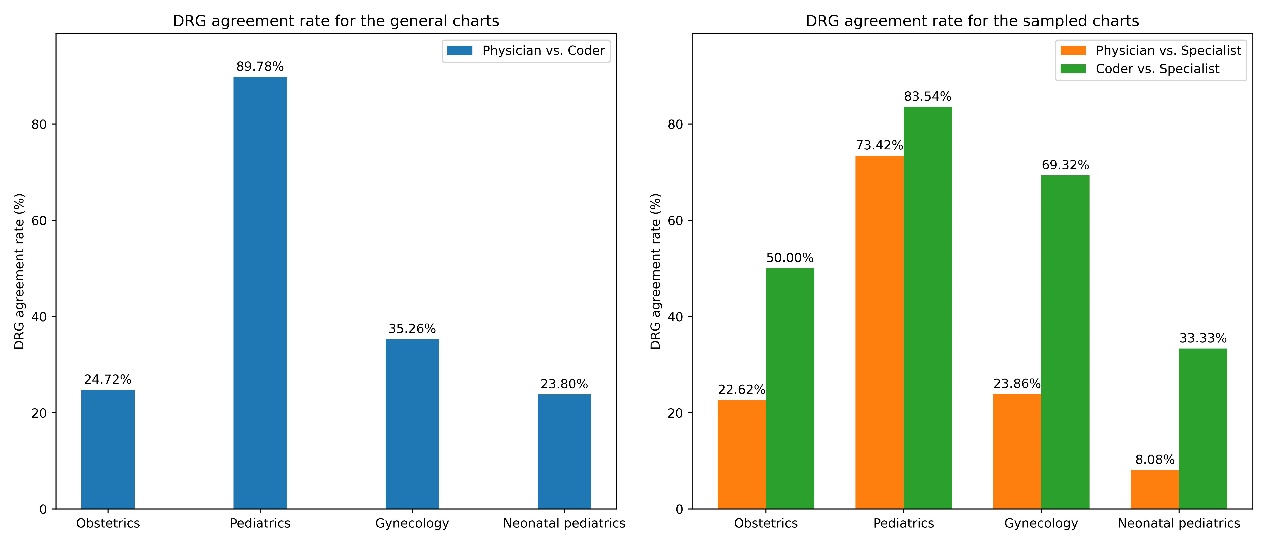
Figure 5: Comparison of CMI results across specialties between general and sampled charts
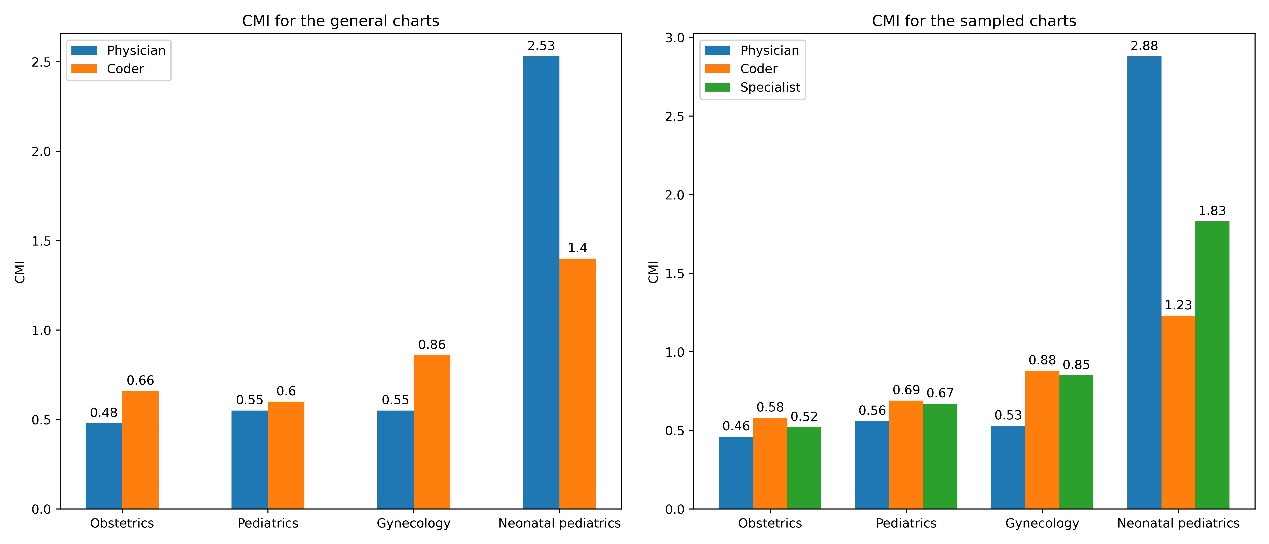
Figure 5. The CMI distribution in the sampled data parallels that of the general data, with specialist CMI positioned between physician and coder.
Figure 6: Comparative of DRG payment results across specialties between general and sampled charts, showing similar distribution patterns in both datasets
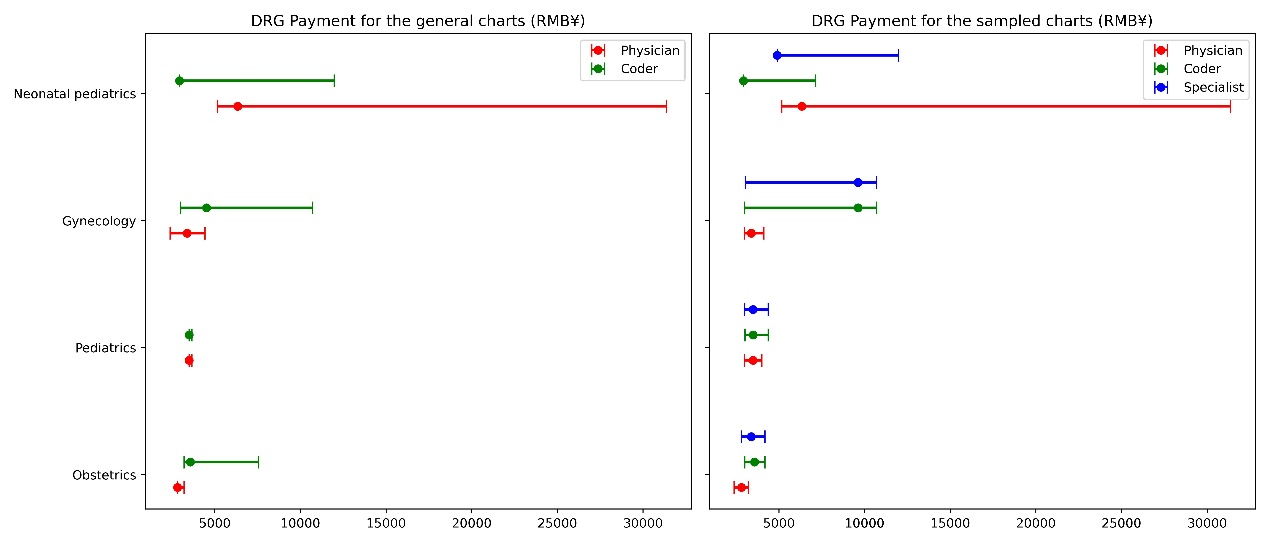
Figure 6. Specialist DRG payment is intermediary between those of physicians and coders.
Appendix B contains a comparison using payments from CN-DRG groupings based on specialist-coded ICD data as the gold standard. Physician-coded ICD data tend to lead to underpayment, with an obstetrics underpayment rate of 52.3 percent and gynecology underpayment rate of 55.6 percent. In contrast, coder-coded ICD data in obstetrics had an overpayment rate of 26.1 percent, while neonatal pediatrics experienced an underpayment rate of 64.6 percent.
Discussion
This study conducted a comparative analysis of ICD codes from different nodes in the process of generating ICD data. The results indicate that the agreement rate of primary diagnosis codes between physician- and coder- was 64.9 percent (with subcategory match) in the general charts. In the sampled charts, physician-coded data exhibited coding error rates ranging from 40.3 percent to 65.1 percent, whereas coder-coded data exhibited coding error rates ranging from 12.2 percent to 23.6 percent. The survey results suggest that the quality of coder- is higher when compared to physician-.
Furthermore, this study utilized data from different nodes to analyze the impact of data quality on DRG grouping results. The results show that in the general charts, the CMI and MDC, DRG agreement of coder- was superior to that of physician- and tended to be more reasonable, except for neonatal pediatrics. Data quality varied significantly among different specialties, which can have varying impacts on DRG grouping payment, physician-coded data were primarily reflected as underpayments in the DRG system. Similar changes were observed in the sampled charts, indicating that the sampled data can reflect the general outcome.
Previous research6-8,11-12 has mainly focused on assessing the accuracy of ICD codes for specific health conditions and highlighted the importance of improving the sensitivity and positive predictive value of certain codes. However, our study's results differ slightly from those of previous investigations. Our study demonstrated that the quality of ICD data varies among different medical specialties, with differences in quality dimensions, such as pediatric diseases having relatively simple coding with better quality. In contrast, obstetrics and neonatal pediatrics have more complex coding with many specialty-coding rules, such as preferred chapters and combination codes, resulting in more coding quality issues. ICD coding quality can be influenced by various factors, such as the complexity of specialty diseases, the expertise of coders, and the quality assessment process and indicators. It is worth noting that DRGs are primarily calculated based on ICD codes, and poor-quality data can lead to risks, including erroneous payments, inaccurate healthcare management, and adverse events 12-14. Therefore, healthcare administrators are highly concerned with effectively enhancing the quality of ICD data, and establishing a standardized ICD data quality assessment process is crucial for this research.
Numerous information management systems have implemented quality control measures for ICD codes. However, the inconsistent use of terminology and lack of standardized assessment methods make it challenging to compare data quality results across multiple data-sharing partners, even though these studies have established their own methods and indicators for researching data quality. The goal of DQA research is to develop reusable and systematic methods for assessing and reporting data quality, as well as to increase the frequency and reproducibility of data validation. For example, Khan15 harmonized and organized data quality terms into a framework, while Weiskopf16 developed a 3x3 DQA guideline, and Rogers17 contributed to the data element-function conceptual model. Diaz-Garelli18 designed a systematic DQA framework called DataGauge.
In this study, we innovatively employed the 3x3 DQA guidelines framework16 to construct a standardized method and indicators for evaluating the quality of ICD data. The metrics and formats utilized to present the data quality findings can enhance comprehension and transparency regarding the data limitations. We randomly sampled 350 charts and used specialist-coded data as the gold standard to evaluate the quality of data at different stages of the ICD generation process using the DQA approach. Appendix B provides a detailed explanation of the results of the evaluation of physician- and coder-data across various quality dimensions. The results revealed that the coder-coded data surpassed the physician- across all quality dimensions. In particular, the majority of the current quality dimensions were 0 percent, which indicates that our model still requires reliability and validity verification. Subsequent research should consider whether this dimension is necessary or requires improvement.
The generation of ICD data is a complex process involving multiple nodes, each of which may contribute to data quality issues due to inconsistencies in the information and knowledge of the participants. In the current management of hospital institutions in China, physicians still serve as the primary monitors of patient hospitalization expenses. They must control hospitalization expenses during a patient's stay based on the patient's condition and treatment, while also referring to DRG or DIP grouping results. However, it is unreasonable for clinical doctors to perform ICD coding since they lack an understanding of the meaning and requirements of ICD coding. Moreover, the ICD coding they perform is solely for the purpose of cost control. This study's findings indicate that physician-coded data has poor quality and can result in more error grouping paths and error payments, potentially leading to adverse effects on future hospital resource allocation evaluations. Therefore, the current ICD coding workflow requires improvement. The Medicare insurance reimbursement should be based on data coded by professional coders, with doctors serving only as assistants in disease coding work.
Additionally, we have gained a profound understanding of both domestic and international ICD coding practices. To improve the quality of Chinese ICD data, we recommend the following measures:
First, national coding guidelines are the best method to ensure data quality. In countries like the US and Australia, national coding guidelines are regularly updated based on statistical requirements and the DRG model used, resulting in significant differences. Therefore, it is recommended that China publish a unified coding and grouping guideline at the national level.
Second, China's ICD coding industry faces a relative shortage of human resources, and the qualification requirements are not stringent enough. In contrast, in the US19, around 49 percent of respondents stated that their facility employs only credentialed coders. However, in China only 38 percent of coders are credentialed, and the average monthly workload is 1115.5 charts20. Therefore, ensuring adequate human resources is also a crucial measure to enhance ICD quality.
Third, data audits are the most reliable means of improving quality. Many countries have implemented clinical documentation improvement programs to facilitate accurate code data21-22. In China, audits are primarily managed by medical institutions, and the processes and methods are not standardized. In the future, China's management focus should remain on strengthening the high-quality culture of hospital institutions and establishing a long-term dynamic adjustment mechanism, including data sources, workflows, and management tools.
DRG calculations are primarily based on ICD codes. Our study analyzed data at different stages of the ICD generation process and confirmed that data quality has a significant impact on CN-DRG evaluation variables and payments. Data quality issues vary substantially across different specialties and can have various consequences for DRG grouping. For example, physician-coded data mainly lead to underpayments in the DRG system. As such, it is crucial to ensure the accuracy and reliability of ICD codes. Using the 3x3 DQA guidelines framework, we developed a standardized ICD data quality evaluation process and indicators. We validated the applicability of DQA through sampling data, and the research results provided feasible directions for improving ICD quality management research.
Limitation
The study has several limitations that warrant consideration. First, due to the cross-sectional design of the study, it is not possible to infer the relationship between coding quality and DRG, including the extent and mechanism of its influence. Therefore, it is crucial to conduct prospective studies to confirm the findings from retrospective studies. Second, the study focused solely on specific health conditions, which may limit the generalizability of the results to other settings or conditions. To generate comprehensive and integrated conclusions, future research should consider a range of health conditions in various settings. Lastly, other factors, such as physician experience, workload, and training may confound the quality of ICD codes, but these factors were not explicitly evaluated in the reviewed studies. Future research should assess the impact of these factors on ICD coding quality and develop interventions to mitigate them.
Conclusion
This article analyzes the impact of coding quality on DRG grouping results using physician-coded and coder-coded ICD data from a medical institution in China. Our findings reveal significant variation in coding quality across different specialties and staff, which can have a substantial impact on DRG grouping and payments. The study highlights the need for ongoing efforts to improve the quality of ICD codes in China, and suggests that the DQA process and standardized indicators developed in this study could be used to evaluate the quality of ICD codes in other settings.
The findings of this study have implications for future research and policy. For instance, we have established a standardized ICD DQA model that we will improve based on the research results and attempt to integrate with an intelligent DQA framework for more systematic and reliable data quality management. Furthermore, we believe that computer assisted coding, including machine learning and natural language processing technologies, is a highly effective method to improve the accuracy of ICD codes. Although these technologies are not infallible, human oversight and validation are crucial to ensure ICD data quality.
Abbreviations
ICD: International Statistical Classification of Diseases and Related Problems
DRG: Diagnosis-related Groups
DQA: Data Quality Assessment
CC: Complications and Comorbidities
EMR: Electronic Medical Records
MDC: Major Diagnostic Categories
ADRG: Adjacent Diagnosis-related Groups
MS-DRG: Medicare Severity Diagnosis-related Group
CN-DRG: Chinese Diagnosis-related Group
MCCs: Major Complications and Comorbidities
CMI: Case Mix Index
RW: Relative Weight
Acknowledgements
We thank all members of our study team for their whole-hearted cooperation and the original authors of the included studies for their wonderful work.
Authors` contributions
YZ, DH, and LYW planed and designed the research; LYW provided methodological support/advice; DH, YZ and SYX tested the feasibility of the study; DH and SYX performed the statistical analysis; YZ wrote the manuscript; and DH, CL and LYW revised the manuscript. All authors approved the final version of the manuscript.
Funding
This research was supported by the Natural Science Foundation of Guangdong Province (Grant number: 2021A1515110721) and the National Natural Science Foundation of China (Grant number: 62006054).
Availability of data and materials
The data that support the findings of this study are available from Guangzhou Healthcare Security Administration, but restrictions apply to the availability of these data, which were used under license for the current study and are not publicly available. Data is, however, available from the corresponding author upon reasonable request and with permission of Guangzhou Healthcare Security Administration.
Ethics approval and consent to participate
The study was conducted according to the guidelines of the Declaration of Helsinki and approved by the Health Research Ethics Committee of the Guangdong Women and Children Hospital (IRB#202201241). Patient consent was waived by the Institutional Review Board of Guangdong Women and Children Hospital, because no contact with patients was conducted and patient anonymity was assured. All methods were performed in accordance with the relevant guidelines and regulations.
Consent for publication
Not applicable.
Competing interests
The authors declare no competing interests.
References
[1] Steinbusch, Paul J. M., Jan B. Oostenbrink, Joost J. Zuurbier, and Frans J. M. Schaepkens. “The Risk of Upcoding in Casemix Systems: A Comparative Study.” Health Policy, no. 81 (2007): 289–299. https://doi.org/10.1016/j.healthpol.2006.06.002.
[2] Goldfield, Norbert. “The Evolution of Diagnosis-Related Groups (DRGs): From Its Beginnings in Case-Mix and Resource Use Theory to Its Implementation for Payment and Now for Its Current Utilization for Quality Within and Outside the Hospital.” Quality Management in Health Care, no. 19 (2010): 3–16. https://doi.org/10.1097/QMH.0b013e3181ccbcc3.
[3] US Department of Health and Human Services. “2019 Medicare Fee-for Service Supplemental Improper Payment Data.” Washington, DC, 2021. Available online at https://www.cms.gov/files/document/2019-medicare-fee-service-supplemental-improper-payment-data.pdf. (accessed 20 June 2021).
[4] Alonso V., J. V. Santos, M. Pinto, J. Ferreira, I. Lema, F. Lopes and A. Freitas (2020) “Health records as the basis of clinical coding: Is the quality adequate? A qualitative study of medical coders' perceptions.” Health Information Management Journal 49(1). https://doi.org/10.1177/1833358319826351.
[5] O'Malley, Kimberly J., Karon F. Cook, Matt D. Price, Kimberly Raiford Wildes, John F. Hurdle, and Carol M. Ashton. “Measuring Diagnoses: ICD Code Accuracy.” Health Services Research, no. 40 (2005): 1620–1639. https://doi.org/10.1111/j.1475-6773.2005.00444.
[6] Labgold K, Stanhope KK, Joseph NT, Platner M, Jamieson DJ, Boulet SL. “Validation of Hypertensive Disorders During Pregnancy: ICD-10 Codes in a High-burden Southeastern United States Hospital.” Epidemiology 32(4):p 591-597, July 2021. https://doi.org/10.1097/ede.0000000000001343.
[7] Muir K.W., Gupta C., Gill P., Stein J.D. “Accuracy of International Classification of Diseases, Ninth Revision, Clinical Modification Billing Codes for Common Ophthalmic Conditions.” JAMA Ophthalmology. 2013;131(1):119–120. https://doi.org/10.1001/jamaophthalmol.2013.577.
[8] Mengcen Qian, Xinyu Zhang, Yajing Chen, Su Xu, Xiaohua Ying (2021). “The pilot of a new patient classification-based payment system in China: The impact on costs, length of stay and quality.” Social Science & Medicine, Volume 289,114415, https://doi.org/10.1016/j.socscimed.2021.114415.
[9] Chen, Yj., Zhang, Xy., Tang, X. et al. “How do inpatients’ costs, length of stay, and quality of care vary across age groups after a new case-based payment reform in China? An interrupted time series analysis.” BMC Health Serv Res 23, 160 (2023). https://doi.org/10.1186/s12913-023-09109-z.
[10] Zhou, Jing-ya, Xue Bai, Sheng-nan Cui, Cheng Pang, and Ai-ming Liu. “A Systematic Review of the Quality of Coding for Disease Classification by ICD-10 in China.” Chinese Hospital Management, no. 12 (2015): 32–35. https://doi.org/CNKI:SUN:YYGL.0.2015-12-015.
[11] Farber Jeffrey Ian, and Randall F. Holcombe. (2014) “Clinical Documentation Improvement as a Quality Metric in Oncology.” Journal of Clinical Oncology, no. 30: 123. https://10.1200/jco.2014.32.30_suppl.123.
[12] Jan Horsky, Elizabeth A. Drucker, and Harley Z. Ramelson. (2017) “Accuracy and completeness of clinical coding using icd-10 for ambulatory visits.” AMIA. Annual Symposium proceedings/AMIA Symposium, 912-920. PMID: 29854158; PMCID: PMC5977598.
[13] Bunting, Robert F. Jr., and Daniel P. Groszkruger. (2016) “From To Err is Human to Improving Diagnosis in Health Care: The Risk Management Perspective.” Journal of Healthcare Risk Management, no. 35: 10–23. https://doi.org/10.1002/jhrm.21205.
[14] Ryan P. McLynn, Geddes, Jonathan J. Cui, et al. (2018) “Inaccuracies in ICD Coding for Obesity Would Be Expected to Bias Administrative Database Spine Studies Toward Overestimating the Impact of Obesity on Perioperative Adverse Outcomes.” Spine, no. 7:43. 526-532. https://doi.org/10.1097/BRS.0000000000002356.
[15] Kahn, Michael G., Tiffany J. Callahan, Juliana Barnard, Alan E. Bauck, Jeff Brown, Bruce N. Davidson, Hossein Estiri, Carsten Goerg, Erin Holve, Steven G. Johnson, Siaw-Teng Liaw, Marianne Hamilton-Lopez, Daniella Meeker, Toan C. Ong, Patrick Ryan, Ning Shang, Nicole G. Weiskopf, Chunhua Weng, Meredith N. Zozus, Lisa Schilling. (2016) “A Harmonized Data Quality Assessment Terminology and Framework for the Secondary Use of Electronic Health Record Data.” EGEMS, no. 4: 1244. https://doi.org/10.13063/2327-9214.1244.
[16] Weiskopf, Nicole G., Suzanne Bakken, George Hripcsak, and Chunhua Weng. (2017) “A Data Quality Assessment Guideline for Electronic Health Record Data Reuse.” EGEMS (Washington, DC), no. 5: 14. https://doi.org/10.5334/egems.218.
[17] Rogers, James R., Tiffany J. Callahan, Tian Kang, Alan Bauck, Ritu Khare, Jeffrey S. Brown, Michael G. Kahn, and Chunhua Weng. (2019) “A Data Element-Function Conceptual Model for Data Quality Checks.” EGEMS, no. 7: 17. https://doi.org/10.5334/egems.289.
[18] Diaz-Garelli, Jose-Franck, Elmer V. Bernstam, MinJae Lee, Kevin O. Hwang, Mohammad H. Rahbar, and Todd R. Johnson. (2019) “DataGauge: A Practical Process for Systematically Designing and Implementing Quality Assessments of Repurposed Clinical Data.” EGEMS, no. 7: 32. https://doi.org/10.5334/egems.286.
[19] HCPro, 2011 Coder Productivity Survey A Supplement to Medical Records Briefing. Available online at: https://docplayer.net/8698713-Coder-productivity-benchmarks.html. (accessed 3 July 2021).
[20] Li, Zhong-min, Li-min Xie, Yu-xiong Du, Fang Zeng, and Heng Li. “Investigation and Analysis on the Status Quo of Coders in 109 Hospitals of Hunan Province.” Chinese Medical Record, no. 20 (2019): 8–10, 25. https://doi.org/10.3969/j.issn.1672-2566.2019.04.004.
[21] AHIMA (2018) Clinical documentation improvement. Available at: http://www.ahima.org/topics/cdi (accessed June 28, 2018).
[22] Shepheard J (2018) “What do we really want from clinical documentation improvement programs?” Health Information Management Journal 47(1): 3–5. https://doi.org/10.1177/1833358317712312.
Author Biographies
Ying Zhang, MMed, is an Associate Chief Physician in Medical Record Management and Health Information Management at Guangdong Women and Children Hospital. She received her Master of Medicine degree in Epidemiology and Health Statistics from Southern Medical University. Ying holds certifications in ICD coding and medical record quality control. Her research areas include medical data quality management and the application of medical intelligence systems.
Han Dong, PhD, is a senior statistician and deputy director of the Quality Control Department of the Third Affiliated Hospital of Southern Medical University. He obtained his Bachelor of Science and Ph.D. in Medicine from Southern Medical University.
Shu-yi Xu, BSc, he is a certified Software Test Engineer and the Head of the Research Platform and Data Lake at the Guangzhou Eighth People's Hospital of Guangzhou Medical University. He is dedicated to medical data governance and optimizing data management processes.
Chen Lyu, PhD, received his B.S. degree in Mathematics and Applied Mathematics from Sun Yat-sen University, Guangzhou and his Ph.D. degree in Computer Software and Theory from Wuhan University, Wuhan. He was a visiting student at the Singapore University of Technology and Design. Currently, he is an Assistant Professor at Guangdong University of Foreign Studies. His research interests include natural language processing, machine learning, and bioinformatics.
Ling-yun Wei, MMed, is a Chief Physician in the Department of Medical Information at Guangdong Women and Children Hospital, Guangzhou, China. She received her Master’s degree in Public Health from Sun Yat-sen University. Her research interests include health information management and intelligent monitoring.